Rising Rates ↑, Declining Sales ↓
Quick Take:
-
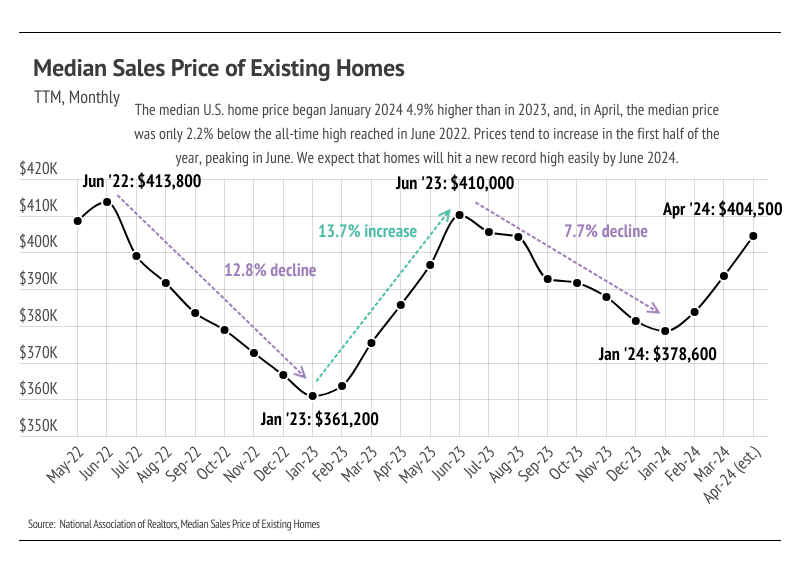
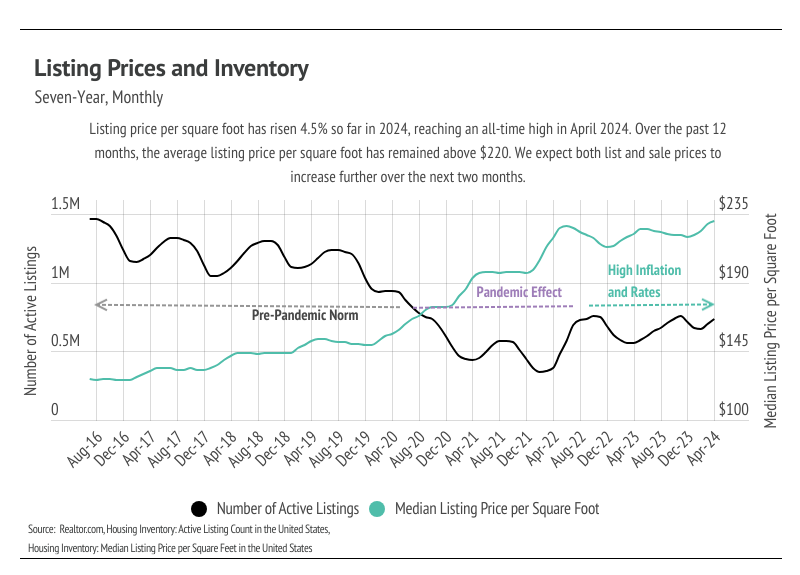
Over the past three months, home prices have increased by 6.8%, now only 2.2% below the June 2022 peak. In April 2024, the median list price per square foot hit an all-time high.
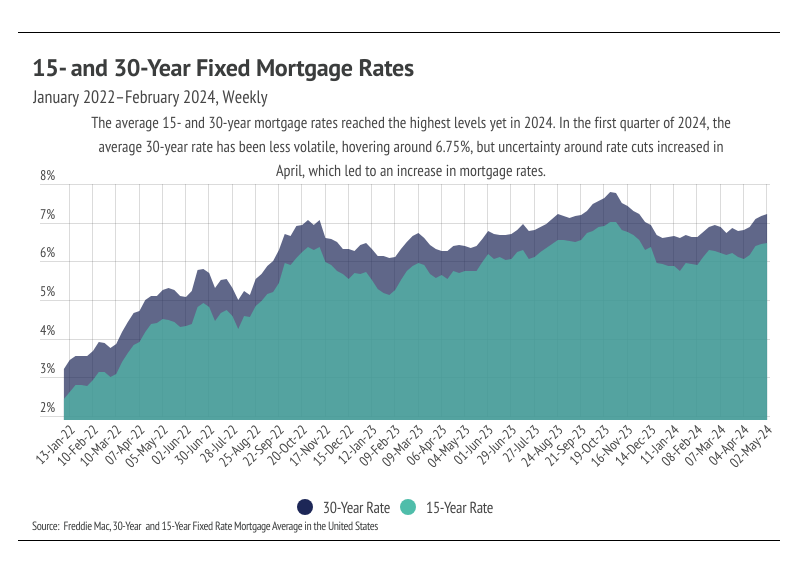
- Mortgage rates jumped nearly half a percentage point in April due to shifting expectations about Fed rate cuts, reaching the highest levels seen in 2024. The Fed has indicated that inflation is stabilizing more slowly than anticipated, suggesting high rates could persist throughout the year.
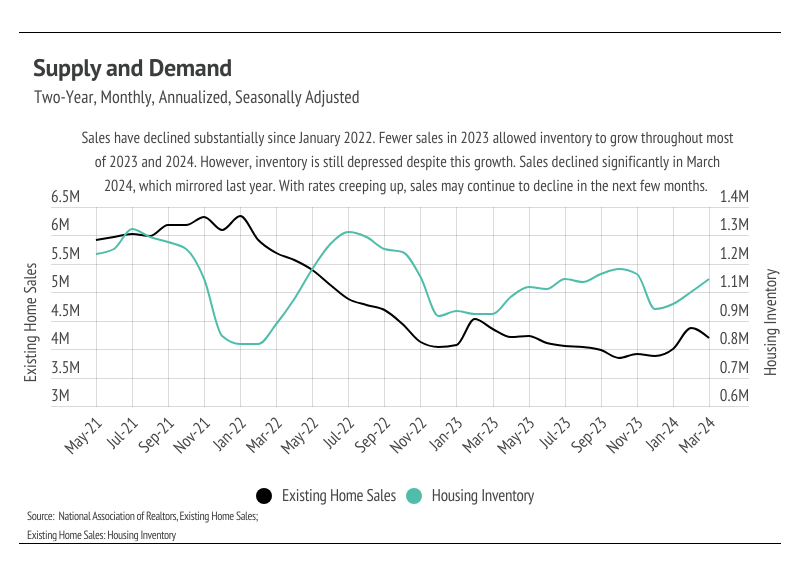
- Sales dropped 4.3% from the previous month, while inventory rose by 4.7%. The combination of higher prices and interest rates has priced many buyers out of the market, reducing sales.
Market slowdown
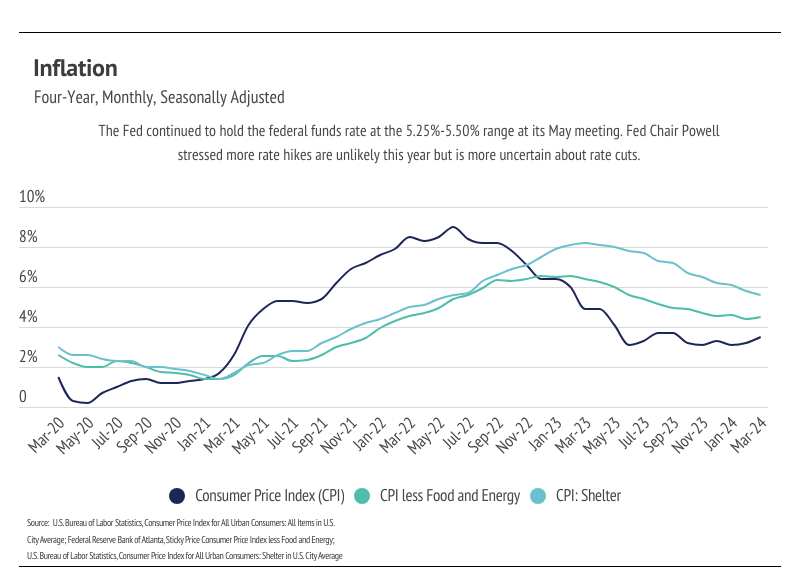
The average 30-year mortgage rate started the year at 6.62%, marking the third consecutive year of elevated rates. Initially, lower inflation trends had economists predicting rate cuts as early as March, but inflation stalled around 3%, leading the Fed to maintain the federal funds rate at 5.25% to 5.50%.
The Federal Reserve's decision to keep rates steady has resulted in significantly higher mortgage rates, which have risen by 0.6% since the beginning of the year, with two-thirds of this increase occurring in April. This surge in rates has slowed the housing market considerably. By May, the average 30-year mortgage rate reached 7.22%, the highest in 2024 and close to the 23-year high of 7.79% set last year.
As prices and rates increased in April, affordability decreased. The combined effect of price and mortgage rate increases led to a 7% rise in monthly home costs in April alone and a 13% rise from January to April.
Historically, low rates have spurred both price increases and sales, but high rates have only slowed sales, a trend seen over the past four years. Despite growing inventory, demand remains high relative to supply. As prices climb, the remaining buyers become more selective, leading to an overall market slowdown. The recent rate hikes have disrupted the usual spring increase in sales, causing a rare decline.
Big Story Data
Local Insights
Southern California Market Highlights:
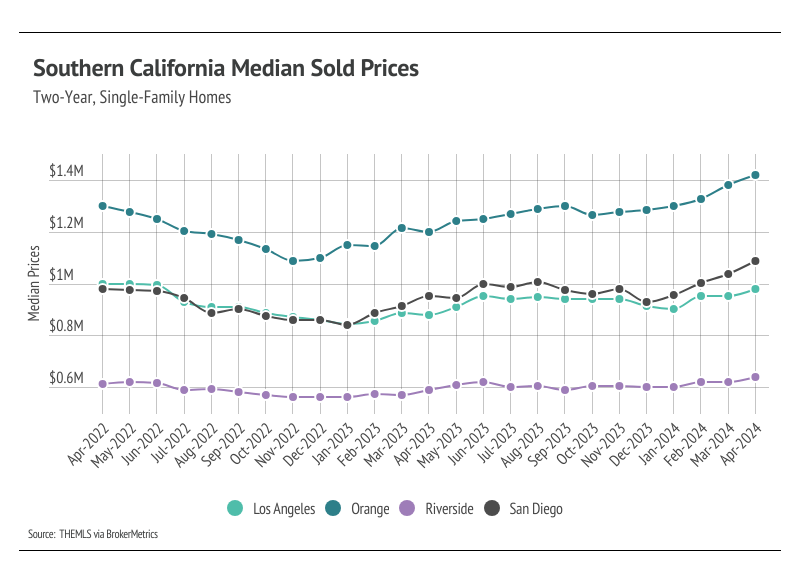
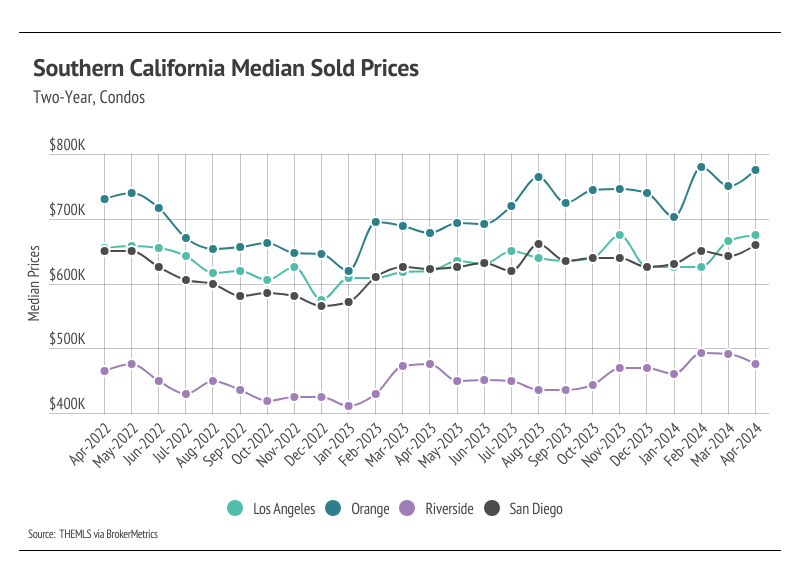
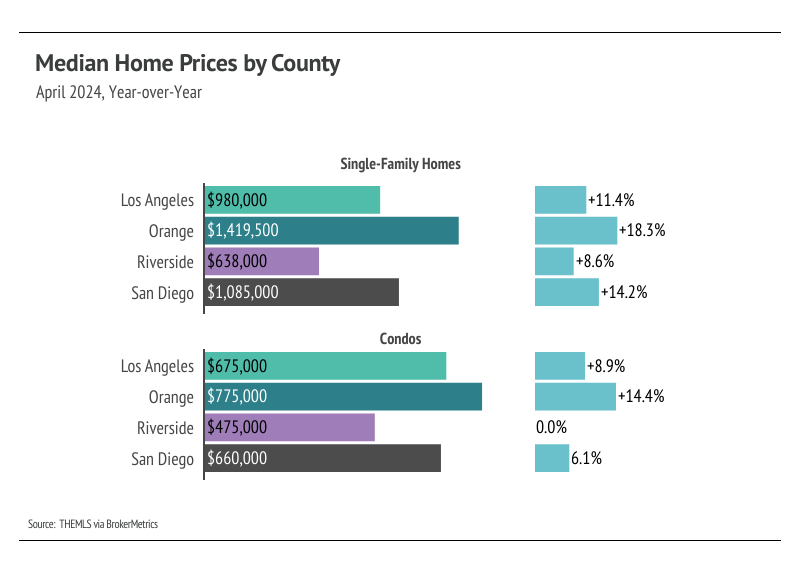
- Median single-family home prices reached record highs in Orange, Riverside, and San Diego counties, with condo prices just below peak levels. New highs are expected for both single-family homes and condos throughout the second quarter of 2024.
- Active listings in Southern California increased by 1.5% month-over-month as new listings outpaced sales. Although housing supply remains historically low, any inventory increase is beneficial in the current market.
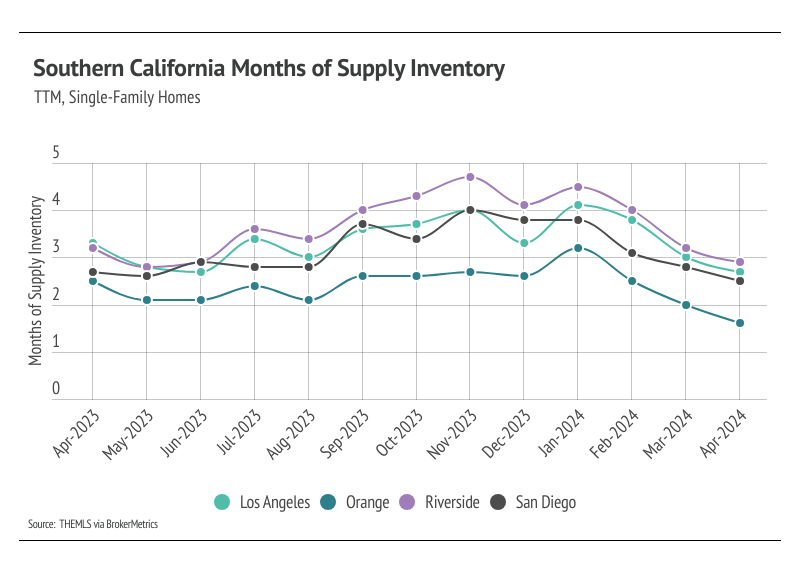
- Months of Supply Inventory (MSI) fell below three months across Southern California markets in April, indicating a strong sellers' market.
Price Trends
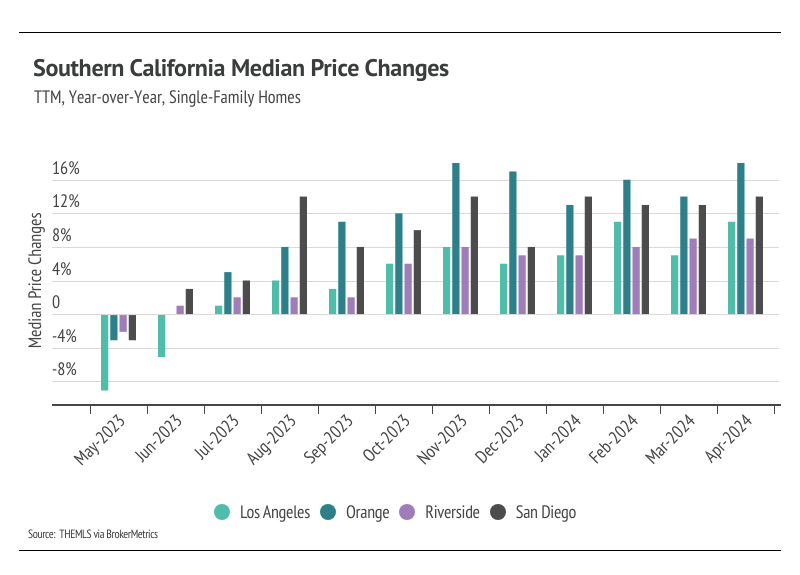
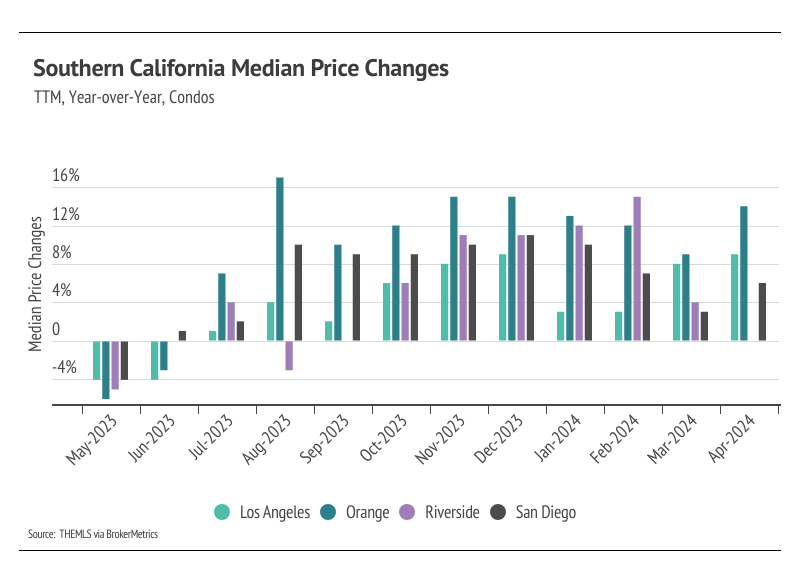
In April, Southern California saw new record highs in single-family home prices due to low inventory and high demand, which offset the price pressures from rising mortgage rates. Record highs were noted in Orange, Riverside, and San Diego counties. Condo prices also rose, hitting an all-time high in Los Angeles. Given the typical summer price peak, single-family home prices are expected to continue rising in the first half of the year, with condo prices likely reaching new highs by June or July.
Market Dynamics
High mortgage rates are dampening both supply and demand. While buyers tolerated rates above 6%, rates above 7% may slow sales slightly in the coming months, potentially allowing inventory to build in a market with significant supply shortages.
Inventory and Sales
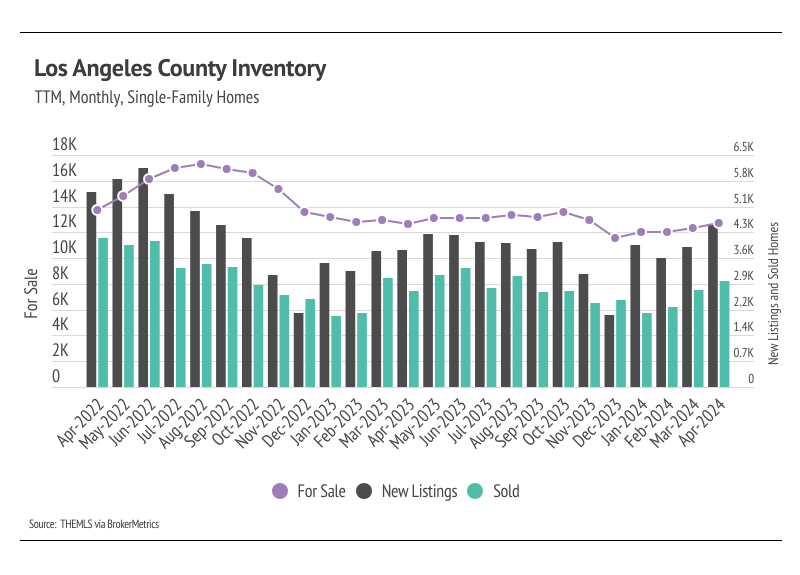
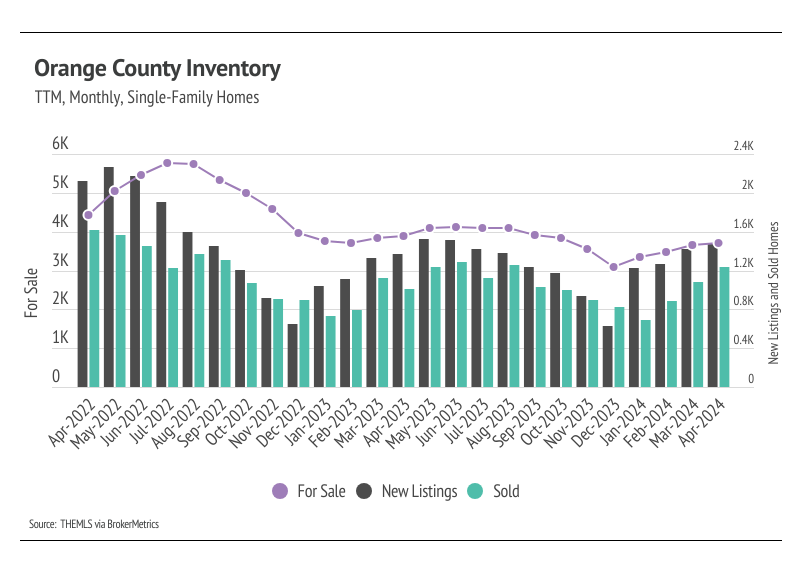
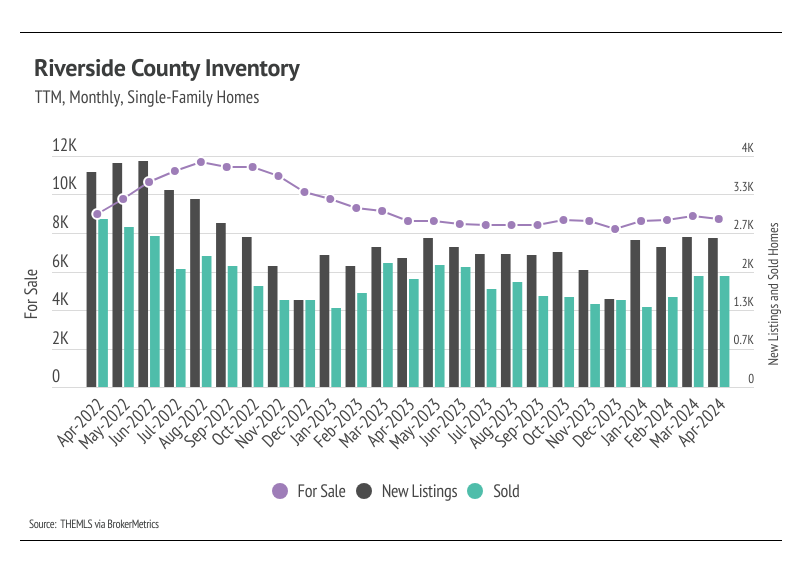
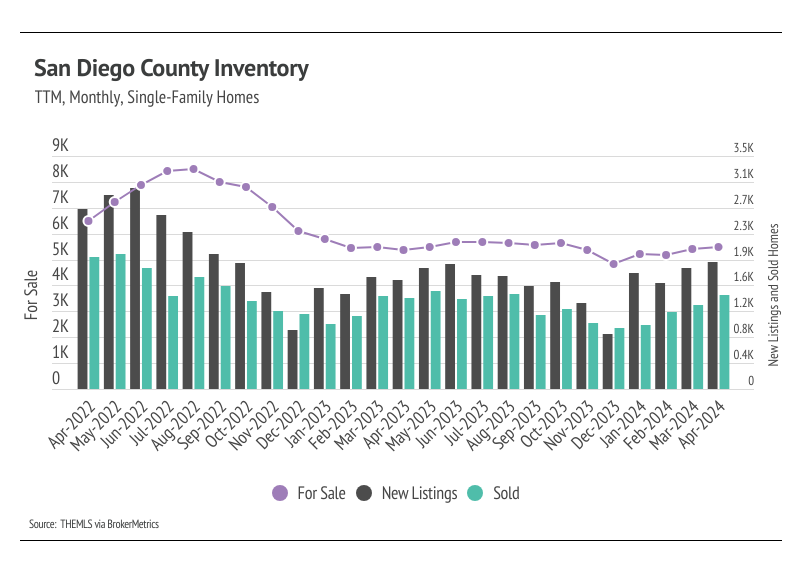
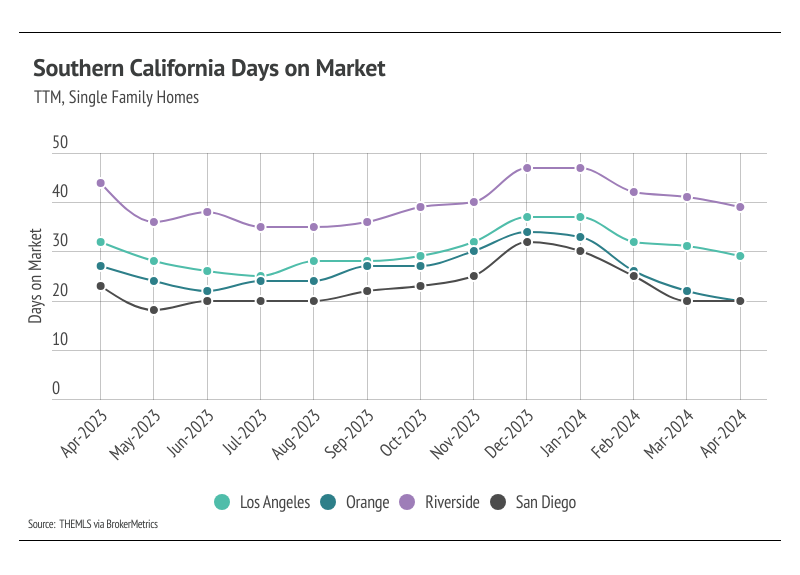
Total active listings, sales, and new listings rose in March and April 2024, except in Riverside County, where all three metrics declined. Inventory has generally trended lower from August 2022 to the present, with fewer listings entering the market. While inventory typically peaks in the summer, 2023 did not follow this pattern. Despite hopes for increased listings after a 92% month-over-month rise in January 2024, new listings have not grown sufficiently to significantly boost inventory. In April, new listings rose by 9% month-over-month, and sales increased by 8%. Year-over-year, inventory is up 4%, and sales are up 9%.
Seller's Market
The Months of Supply Inventory (MSI) in April 2024 indicated a sellers' market across Southern California. MSI measures the time it would take to sell all current homes on the market at the current sales rate. Historically, an MSI around three months indicates a balanced market. In recent months, MSI has fallen below three months in all Southern California counties, reinforcing the sellers' market conditions.
Local Lowdown Data
As mortgage rates remain high and inflation persists, the housing market faces continued challenges. However, local variations and individual property differences mean there are always unique opportunities. We'll keep monitoring the housing and economic markets to provide the best guidance for your buying or selling decisions.